


It is fair to say that the recent transfer strategy at Man United hasn’t worked. They have seen several players come in on big-money deals, and leave seasons later as flops for pennies.
During the summer, Antony left the club for over £50m less than United paid for him in 2022. Rasmus Hojlund left the club for £38m, when the Red Devils paid £72m for him just two years ago, and Jadon Sancho left on loan again, a wasted investment of £73m in 2021.
Ruben Amorim’s side are 14th in the Premier League table, on seven points after just six games, and after another huge summer spend where they signed the likes of Bryan Mbeumo, Matheus Cunha, and Benjamin Sesko, the Red Devils are still languishing near the bottom of the table.
But how does their net spend compare to their results? United sit low down in the Premier League table, considering net spend versus results. Success on a tight budget is rewarded, while overspending without a return is punished. Each team’s net spend over the past five years is decimalised and subtracted from one, and then it is multiplied by 1.2 to provide the weighting. The table was created by the Hyperset Sports Data group.
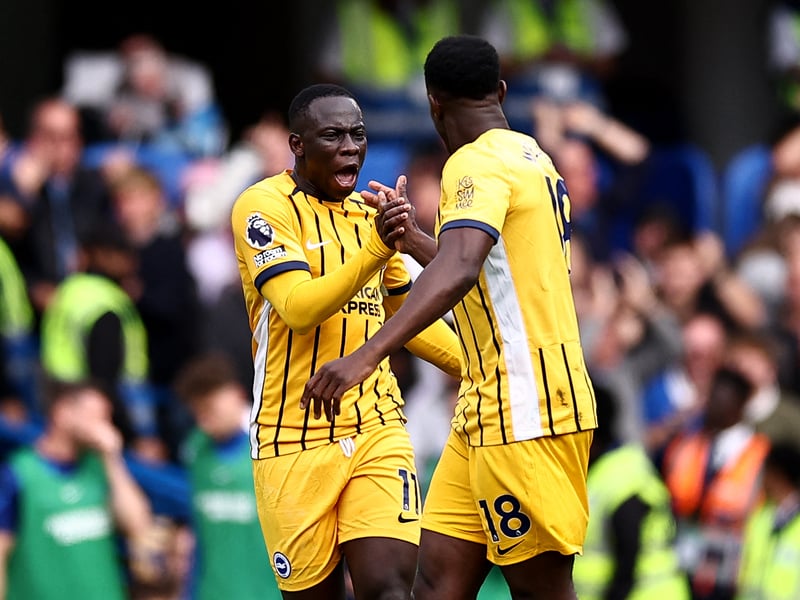
17. Brighton - (4th)
10.6 points | AFP via Getty Images

18. Bournemouth - (3rd)
11.2 points | Getty Images

19. Sunderland - (2nd)
11.6 points | Getty Images
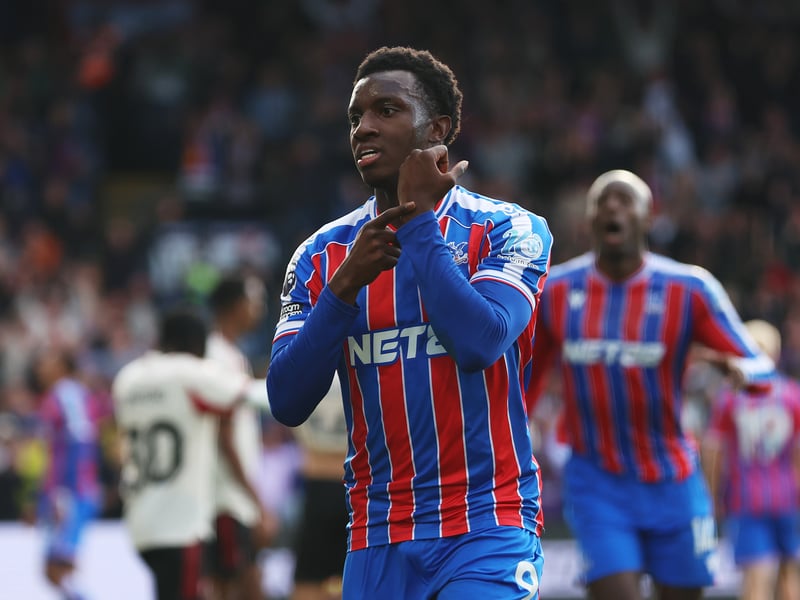
20. Crystal Palace - (1st)
12.3 points | Getty Images