
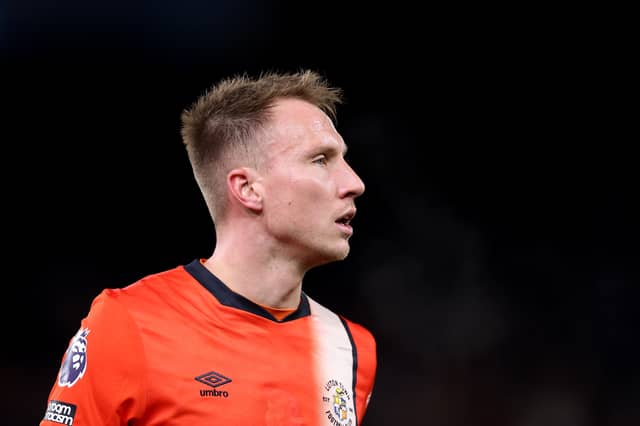


Manchester City and Manchester United still have plenty of time to meet their pre-season objectives, but how do each of them rank in the fair play table? City are fighting to get back into the title race currently, while United are bidding to secure European qualification of some sort.
In the meantime, we have put together the latest Premier League fair play table to see where City and United rank. The points are calculated by giving one point for each yellow card, three for a second yellow card and five for a red card. Take a look below to see where the two Manchester sides place.
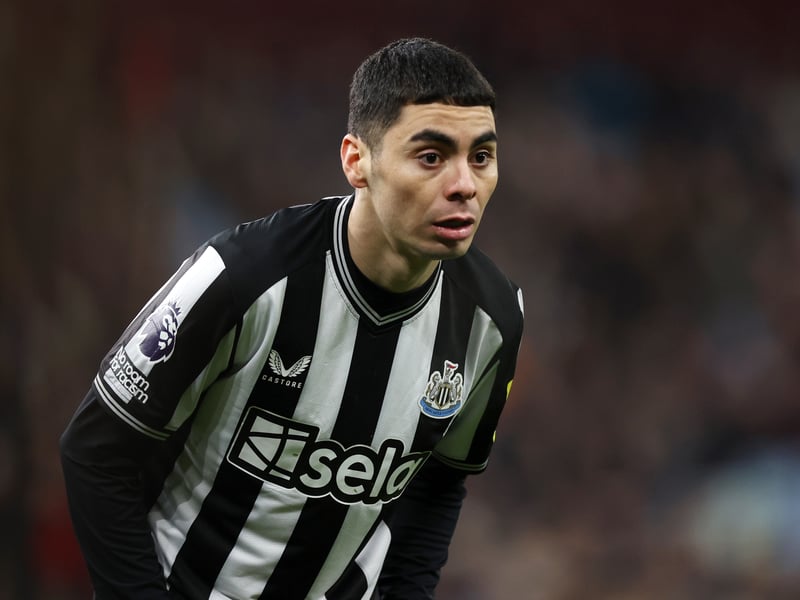
9. Newcastle United - 55
Yellows: 55 Reds: 0 Second yellows: 0 | Getty Images
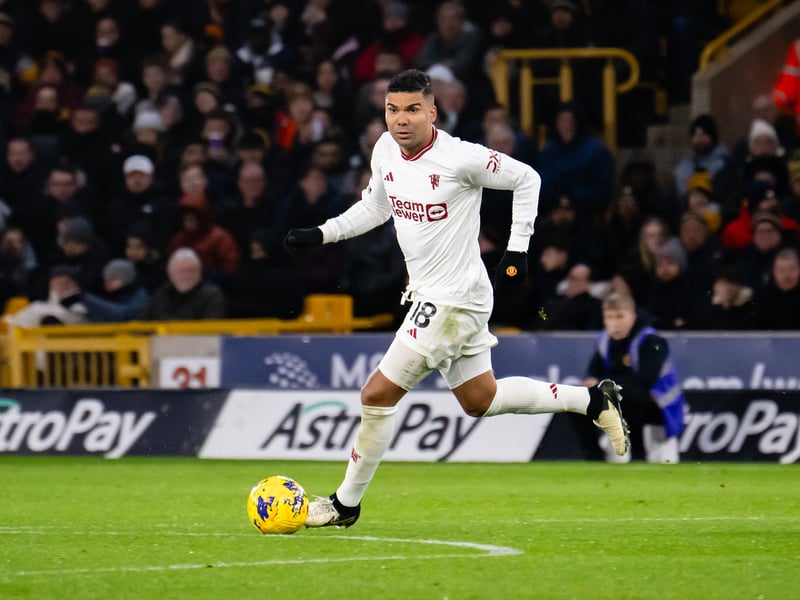
10. Manchester United - 56
Yellows: 53 Reds: 0 Second yellows: 1 | Manchester United via Getty Imag
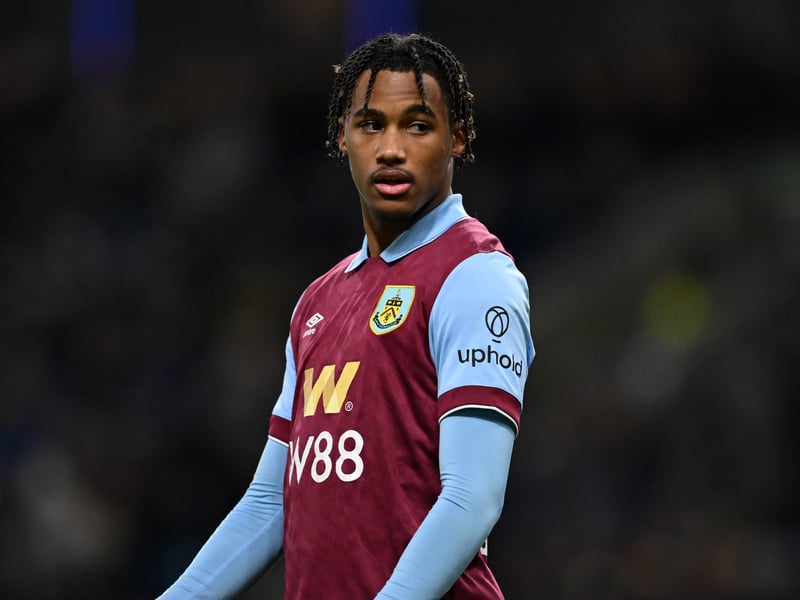
11. Burnley - 57
Yellows: 41 Reds: 2 Second yellows: 2 | Getty Images
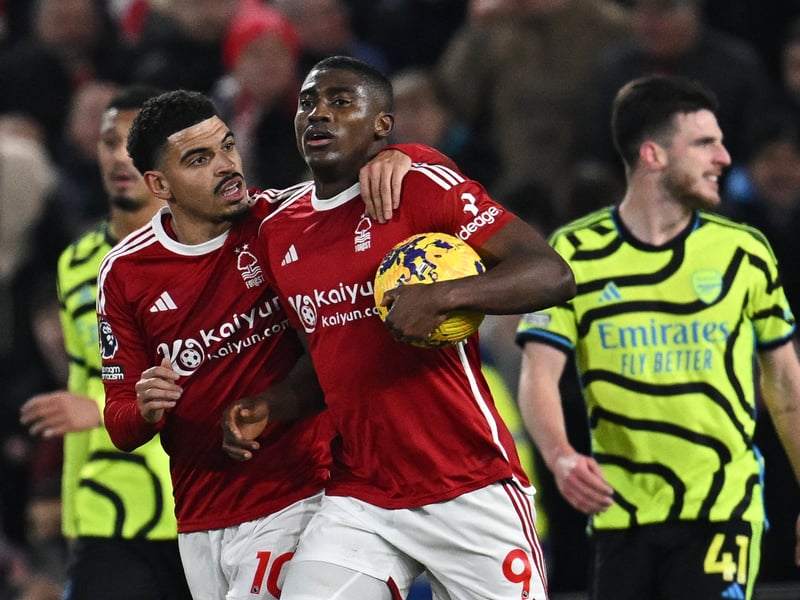
12. Nottingham Forest - 58
Yellows: 47 Reds: 1 Second yellows: 2 | AFP via Getty Images