


ManchesterWorld has already looked at the areas across the city where the 2021 Census says deprivation has fallen most compared to the previous survey. But what about the picture across the rest of Greater Manchester?
We’ve now looked at the same data from the latest national survey and picked out the two neighbourhoods in each of the city-region’s other nine boroughs which have seen the biggest increases in households which are not suffering from any form of deprivation.
There are lots of possible ways to measure household deprivation, and the method used by the Office for National Statistics doesn’t take income into account. Instead, it looks at four different measures: unemployment, low qualification levels, poor health and bad housing.
Neighbourhoods are officially known as middle-layer super output areas, which have between 5,000 and 15,000 residents living in them. The Census divides England and Wales into more than 7,000 MSOAs publishes how many households were deprived in at least one of its four measures for each of them.
There are of course exceptions, but it is notable across Greater Manchester how many of the biggest reductions in household deprivation happened in areas where it was extremely high to start with in 2011. Indeed some of the largest improvements came in areas where only around one in five households was not struggling with some kind of deprivation just over a decade ago.
The flipside of this, though, is that this data shows that in many areas of Greater Manchester, including those which are improving, there are still many people struggling, with more than half of households in these places still deprived in one of the four areas the ONS identifies.
Here are the areas for each part of Greater Manchester.
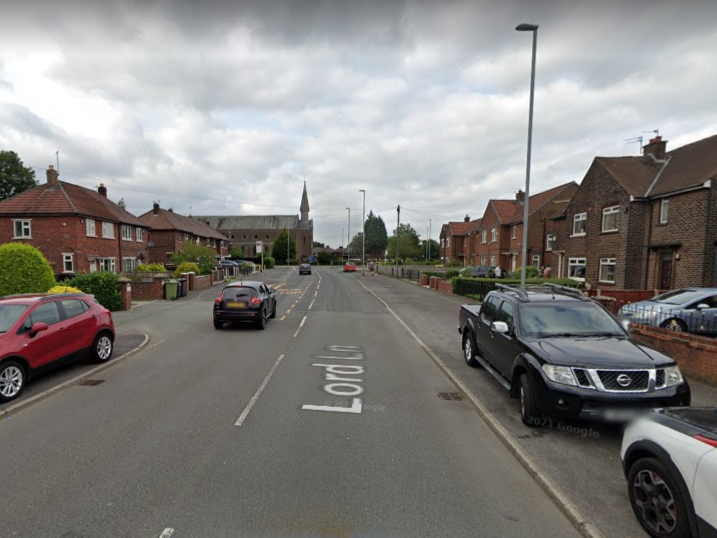
5. Failsworth South
Failsworth is Oldham’s most up and coming area, with the proportion of households not suffering from some kind of deprivation rising from 37.1% in 2011 to 45.4% in 2011. Photo: Google Maps Photo: Google Maps
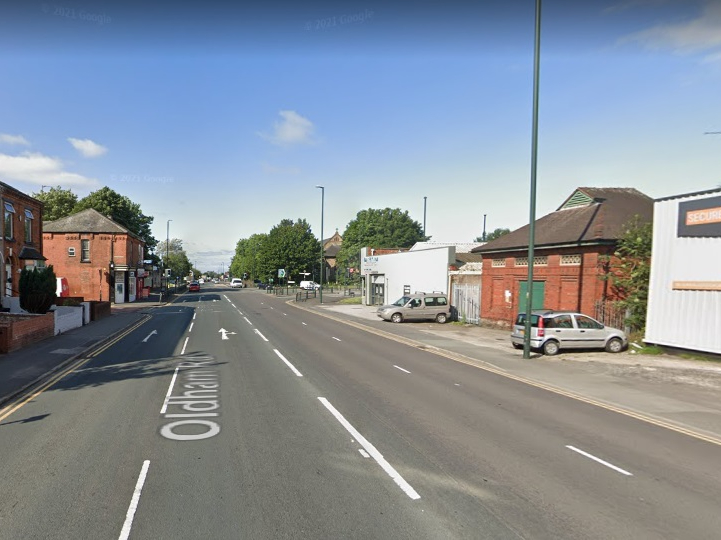
6. Failsworth West
In Failsworth West just under one in three households (32.3%) were not facing some kind of deprivation in 2011, but this had risen to 40.4% by 2021. Photo: Google Maps Photo: Google Maps
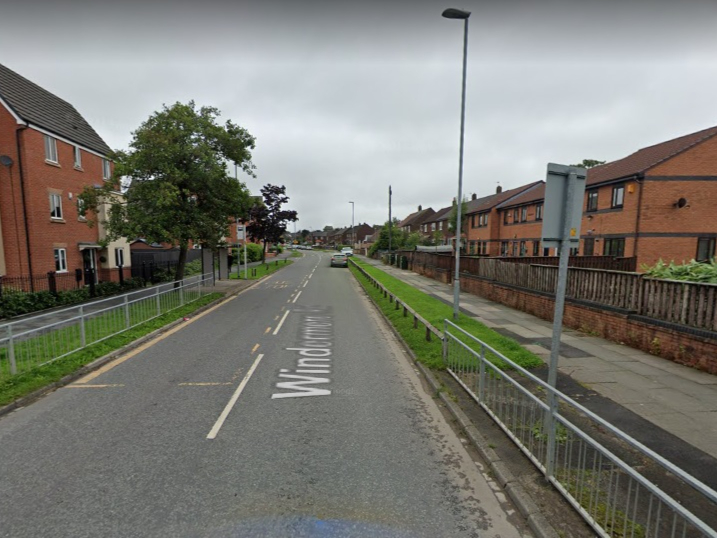
7. Langley and Wood Side
The biggest fall in deprivation in Rochdale came in Langley and Wood Side, where in 2011 some three quarters of households suffered some kind of deprivation but by 2021 37.2% of households were not deprived according to the ONS’ criteria. Photo: Google Maps Photo: Google Maps
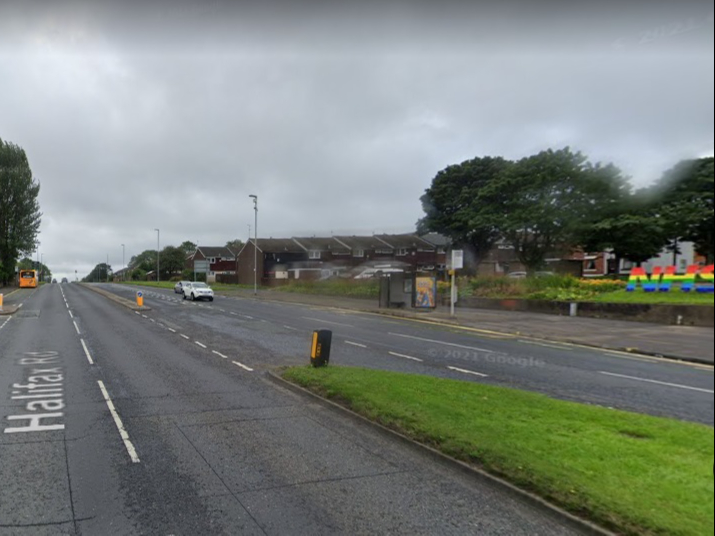
8. Hurstead and Smallbridge
In Hurstead and Smallbridge neighbourhood just 22.3% of households did not have some kind of issue with deprivation in 2011, compared to 32.6% a decade later. Photo: Google Maps Photo: Google Maps