
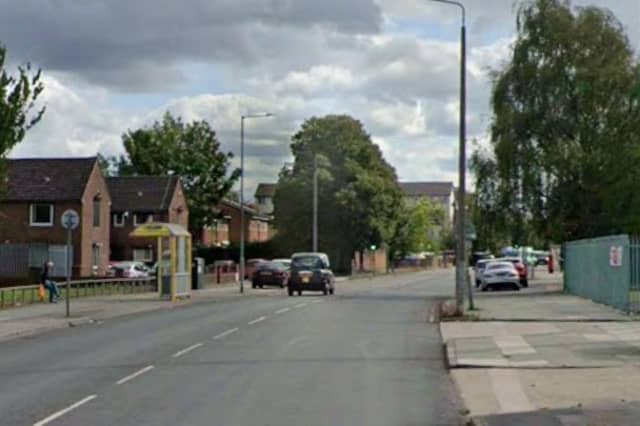


Homes in Manchester and Salford have seen the biggest percentage increases.
All of the top 14 neighbourhoods where the average house price has risen by the biggest percentage between September 2000 and September 2025, according to the latest figures from the Office for National Statistics, are in either Manchester or Salford.
Topping the list is Miles Platting & New Islington North, in Manchester, where the cost of an average home has soared by 1,500%, from £17,500 in September 2000 to £280,000 in September 2025.
To put that into context, if house prices had risen in line with inflation, according to the Bank of England tracker, they would have increased by 91.1% during that period.
There are parts of the North West, including some areas of Manchester, where house prices have risen much more slowly over the last quarter of a century.
Below are the 14 neighbourhoods in the North West where house prices increased by the smallest percentage between 2000 and 2025. They are listed in reverse order.
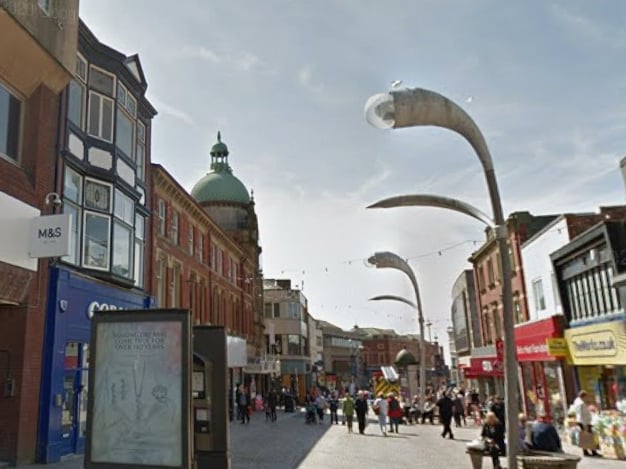
9. Central Blackpool - 114.4%
The average house price in Central Blackpool has risen by 114.4%, from £41,975 in September 2000 to £90,000 in September 2025 | Google Photo: Google
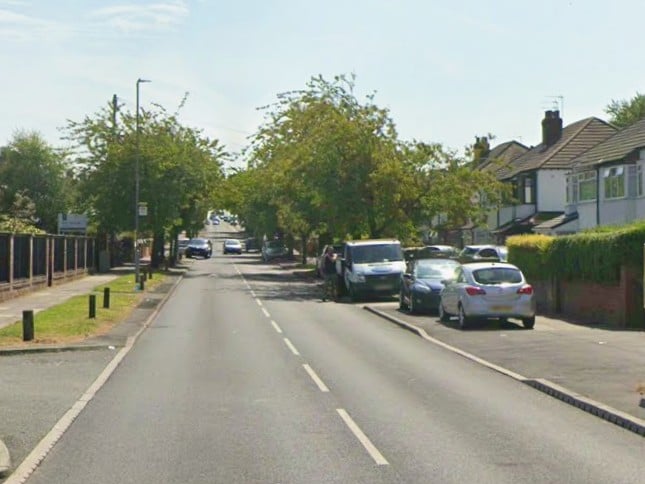
10. Mosscroft & Bakers Green - 111.9%
The average house price in Mosscroft & Bakers Green, Knowsley, has risen by 111.9%, from £75,500 in September 2000 to £160,000 in September 2025 | Google Photo: Google
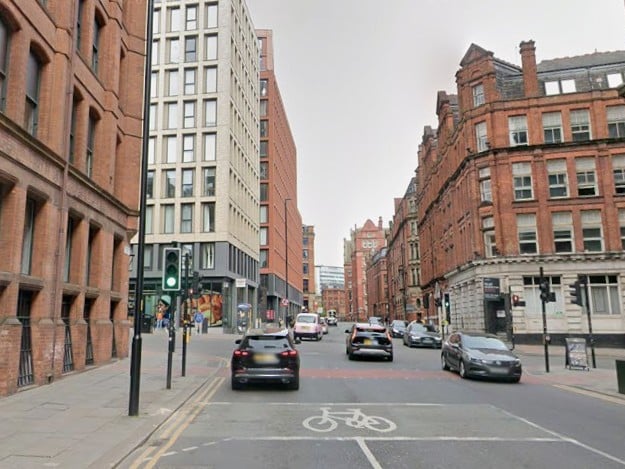
11. University North & Whitworth Street - 109.1%
The average house price in University North & Whitworth Street, Manchester, has risen by 109.1%, from £104,000 in September 2000 to £217,500 in September 2025 | Google Photo: Google
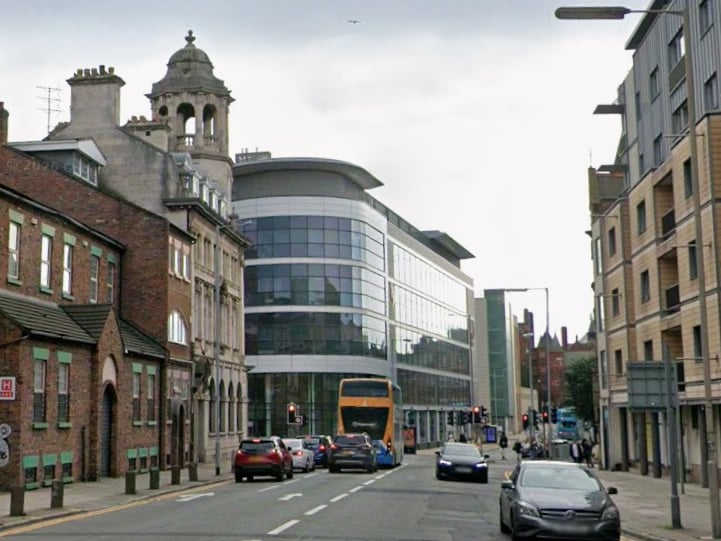
12. Central & Islington - 89.5%
The average house price in Central & Islington, Liverpool, has risen by 89.5%, from £71,250 in September 2000 to £135,000 in September 2025 | Google Photo: Google